Show imports
import torch
import torch.nn as nn
import torch.func as F
import einops
import numpy as np
import matplotlib.pyplot as plt
from torchdiffeq import odeintEtienne Meunier
November 3, 2026
In this post we show that we can learn the invariant of a dynamic from trajectories alone; those invariants are then useful to infer and learn the dynamic itself. We start with a pendulum and simulate a few trajectories.
We start by simulating a few pendulum trajectories at different energy levels. \[ \ddot\theta = -\sin\theta \qquad\Longrightarrow\qquad \begin{cases} \dot\theta = \omega \\ \dot\omega = -\sin\theta \end{cases} \] \[ \kH(\theta, \dot\theta) = \tfrac{1}{2}\dot\theta^2 + 1 - \cos\theta \]
def pendulum_dyn(t, state):
return torch.stack([state[..., 1], -torch.sin(state[..., 0])], dim=-1)
def hamiltonian(state):
return 0.5 * state[..., 1] ** 2 + 1 - torch.cos(state[..., 0])
def init_cond(H):
"""theta at rest (thetadot=0) for a given energy H."""
return torch.arccos(1 - H)
t = torch.linspace(0, 20, 100)
init_theta = init_cond(torch.linspace(0, 2, 10))
init_x = torch.stack([init_theta, torch.zeros_like(init_theta)], dim=-1)
training_set = odeint(pendulum_dyn, init_x, t)
t_exp = t[:, None, None].expand(*training_set.shape[:-1], 1)
training_set = torch.cat([t_exp, training_set], dim=-1)
training_set = einops.rearrange(training_set, 't h c -> h t c') # (level, time, [t, theta, thetadot])colors = plt.get_cmap('viridis')(np.linspace(0.1, 0.9, training_set.shape[0]))
fig, ax = plt.subplots(figsize=(5, 5))
for i in range(training_set.shape[0]):
ax.plot(training_set[i, :, 1], training_set[i, :, 2], color=colors[i])
ax.set(xlabel=r'$\theta$', ylabel=r'$\dot\theta$', title='training trajectories', xlim=(-3, 3), ylim=(-3, 3))
plt.show()
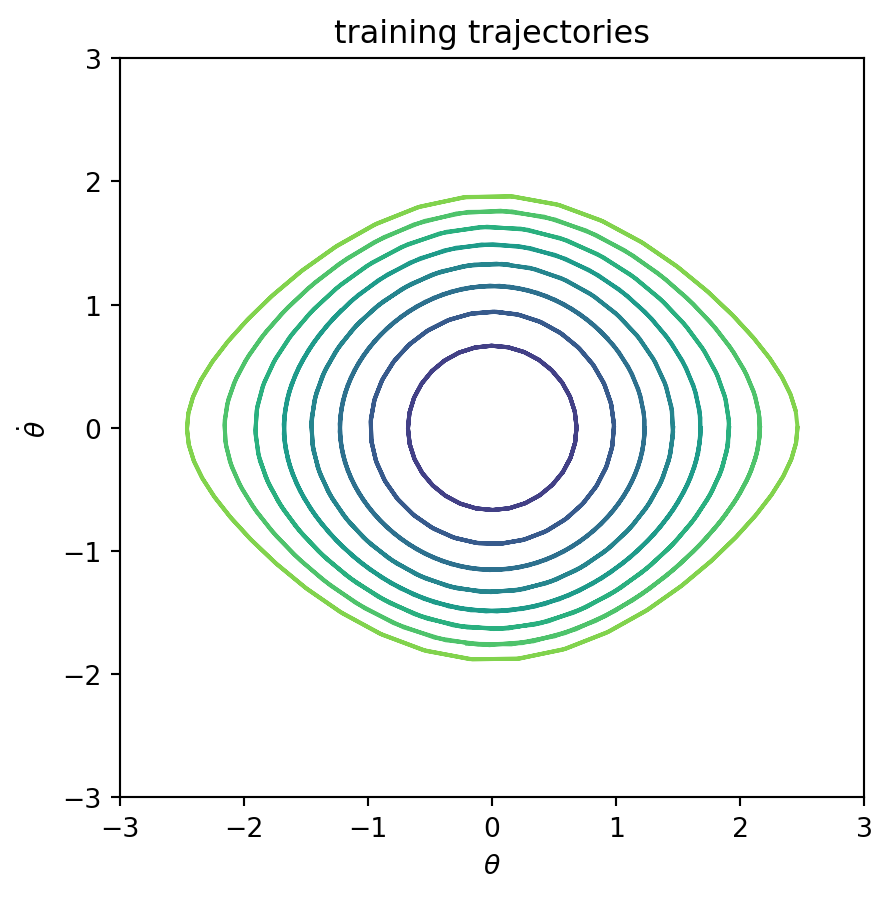
We know that the energy \(\kH\) is conserved along each trajectory — an invariant — and takes a different value for each trajectory, since they start at different points. That’s exactly the structure we are going to exploit here.
Our goal is to learn a representation \(\kE(\text{state})\) that is the same along a trajectory but different between trajectories — that’s simply what we train the model for:
Let \(x_{i,t} \sim \mathcal D\) denote the state at time \(t\) on trajectory \(i\): \[ \mathcal L = \log\Big(\underbrace{\mathbb E_i\big[\mathrm{Var}_t(\kE(x_{i,t}))\big]}_{\text{consistency}}\Big) - \log\Big(\underbrace{\mathrm{Var}_i\big[\mathbb E_t(\kE(x_{i,t}))\big]}_{\text{diversity}}\Big) \]
There is no restriction on the network we want to train, except that it is a smooth \(\mathbb R^p \to \mathbb R\) function.
class Encoder(nn.Module):
"""(theta, thetadot) -> I, a simple 2 -> 1 MLP."""
def __init__(self, hidden=64, n_layers=3):
super().__init__()
layers = [nn.Linear(2, hidden), nn.Tanh()]
for _ in range(n_layers - 1):
layers += [nn.Linear(hidden, hidden), nn.Tanh()]
layers += [nn.Linear(hidden, 1)]
self.net = nn.Sequential(*layers)
def forward(self, x):
return self.net(x).squeeze(-1)
encoder = Encoder()We just train by taking batches of trajectories and minimizing the representation loss.
optimizer = torch.optim.LBFGS(encoder.parameters(), lr=1.0, max_iter=20, line_search_fn="strong_wolfe")
n_epochs = 100 # each step() already runs up to max_iter internal iterations
def closure():
optimizer.zero_grad()
I = encoder(training_set[..., 1:]) # (n_levels, n_times)
loss = loss_f(I)
loss.backward()
return loss
for epoch in range(n_epochs):
loss = optimizer.step(closure)
if epoch % 20 == 0:
print(f"epoch {epoch:4d} loss {loss.item(): .4e}")epoch 0 loss 4.1097e+00
epoch 20 loss -1.2861e+01
epoch 40 loss -1.3517e+01
epoch 60 loss -1.3517e+01
epoch 80 loss -1.3517e+01
And now we can visualize the output of the network on our phase space, next to the Hamiltonian.
g_theta = torch.linspace(-torch.pi, torch.pi, 100)
g_thetadot = torch.linspace(-3, 3, 100)
grid = torch.stack(torch.meshgrid([g_theta, g_thetadot], indexing='xy'), dim=-1)
g_H = hamiltonian(grid)
g_H[g_H > 2] = torch.nan
g_E = encoder(grid).detach()
g_E[hamiltonian(grid) > 2] = torch.nan
fig, axs = plt.subplots(1, 2, figsize=(11, 4.5))
for a, field, title in zip(axs, [g_H, g_E], ['Hamiltonian $H(x)$', 'encoder(x)']):
cf = a.contourf(g_theta, g_thetadot, field)
fig.colorbar(cf, ax=a)
a.set(title=title, xlabel=r'$\theta$', ylabel=r'$\dot\theta$', xlim=(-3, 3), ylim=(-3, 3))
fig.tight_layout()
plt.show()
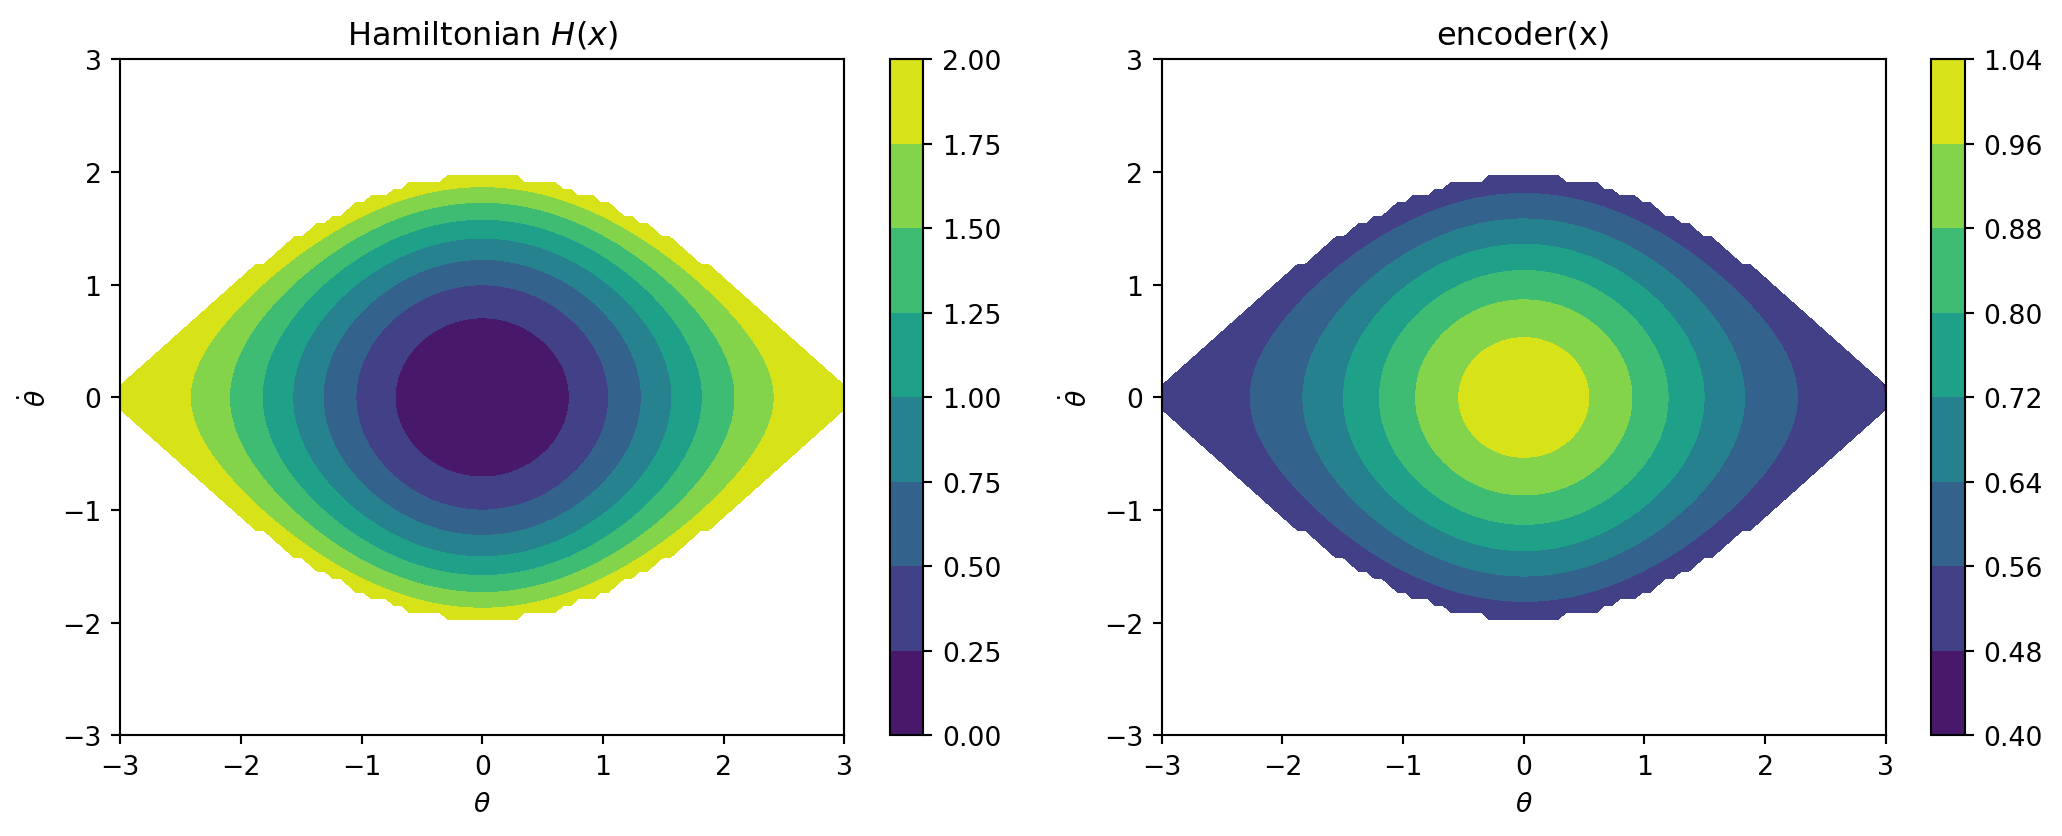
They are quite different — although they share a characteristic: both are smooth functions, monotonically decreasing outward from the fixed point, and since they are both constant on real trajectories they share something even better: contour lines.
fig, axs = plt.subplots(1, 2, figsize=(11, 4.5))
for a, field, title in zip(axs, [g_H, g_E], ['Hamiltonian $H(x)$', 'encoder(x)']):
a.contour(g_theta, g_thetadot, field, colors='k', linewidths=0.8)
a.set(title=title, xlabel=r'$\theta$', ylabel=r'$\dot\theta$', xlim=(-3, 3), ylim=(-3, 3))
fig.tight_layout()
plt.show()
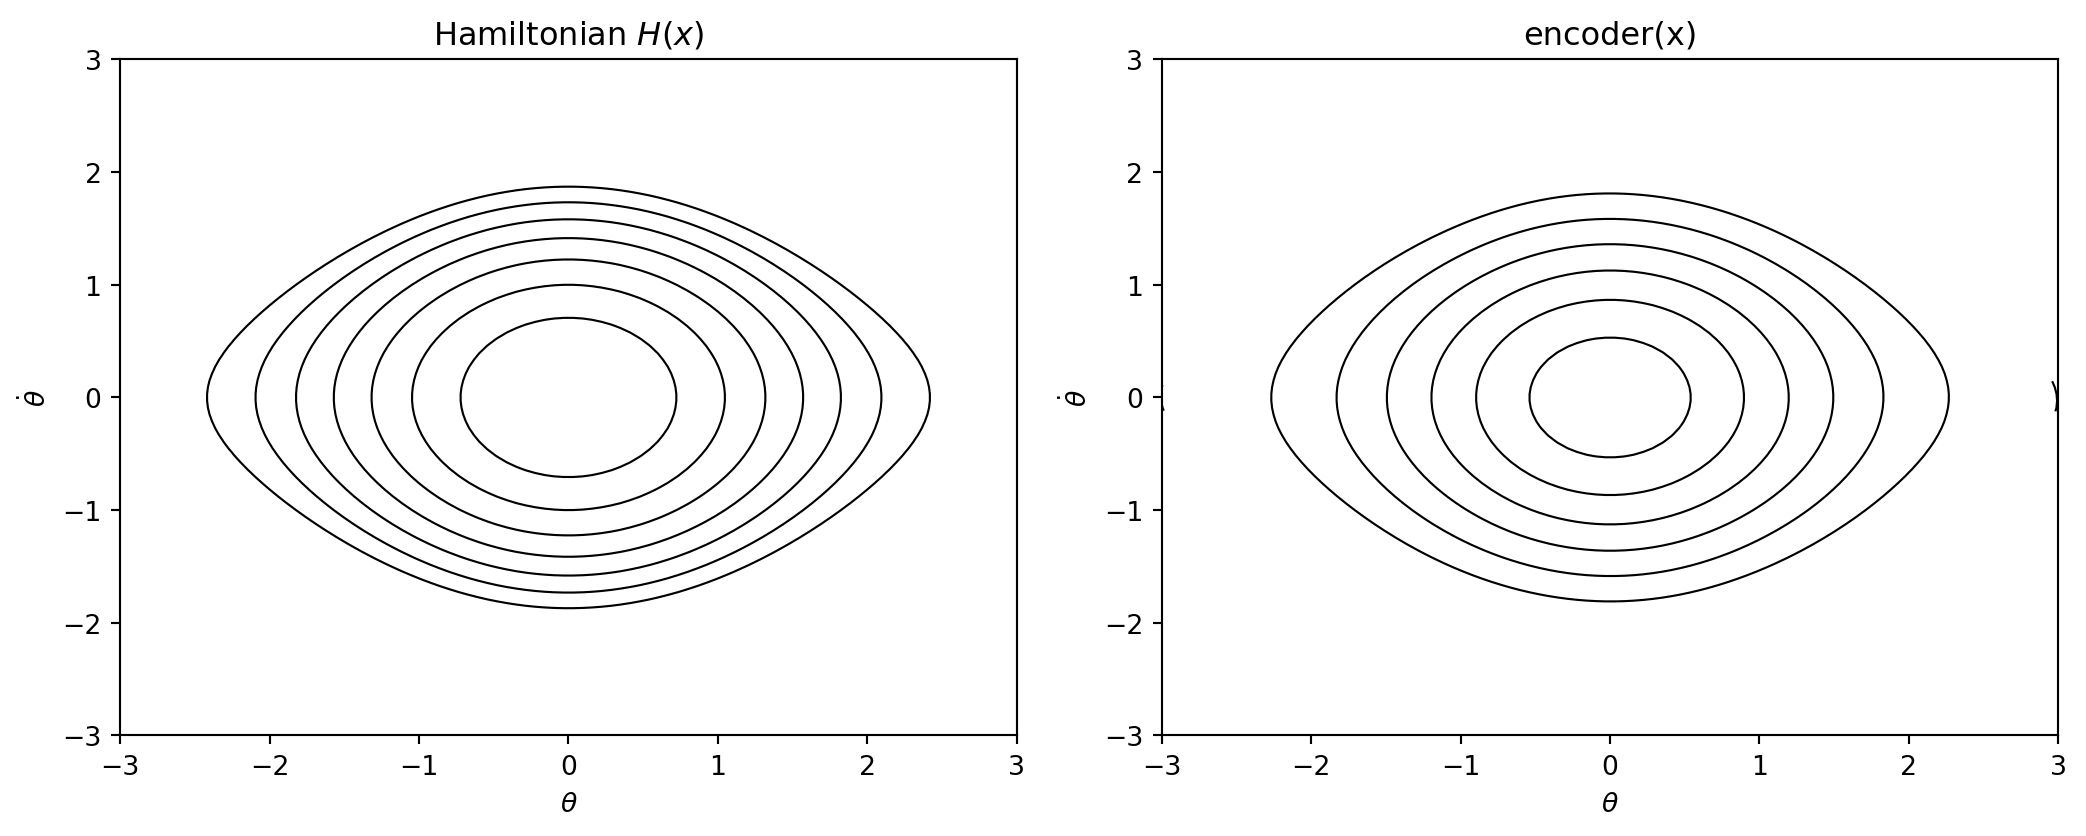
From the contour lines we can retrieve the direction of the dynamics at each point: \(\kH(x(t))\) is constant \(\forall t\), so \[ \frac{d\kH(x)}{dt} = 0 \;\to\; \nabla \kH(x) \cdot \frac{dx}{dt} = 0 \;\to\; \frac{dx}{dt} = \kalpha(x) \nabla^{\perp} \kH(x) \] so the dynamics must be a scaling \(\kalpha(x)\) of the perp gradient along the contour line, where \[ \nabla^{\perp} \kH(x) = \begin{bmatrix}0 & 1 \\ -1 & 0\end{bmatrix} \nabla \kH(x) \] We can already draw a stream plot of the dynamic, taking \(\kalpha(x) = 1\) for now.
def perp(g):
return torch.stack([g[..., 1], -g[..., 0]], dim=-1)
grid_req = grid.clone().requires_grad_(True)
grad_E = torch.autograd.grad(hamiltonian(grid_req).sum(), grid_req)[0]
grid_req = grid.clone().requires_grad_(True)
grad_enc = torch.autograd.grad(encoder(grid_req).sum(), grid_req)[0]
mask = (hamiltonian(grid) > 2).float()
pend_vel = torch.stack([grid[..., 1], -torch.sin(grid[..., 0])], dim=-1)
fig, axs = plt.subplots(1, 3, figsize=(16, 5))
titles = ['pendulum dynamics', r'$\nabla^\perp H$', r'$\nabla^\perp$ encoder']
fields = [pend_vel, perp(grad_E), perp(grad_enc)]
for a, title, field in zip(axs, titles, fields):
a.streamplot(g_theta.numpy(), g_thetadot.numpy(), field[..., 0].detach().numpy(), field[..., 1].detach().numpy())
a.contourf(g_theta.numpy(), g_thetadot.numpy(), mask.numpy(), levels=[0.5, 1.5], colors=['lightblue'], alpha=0.5)
a.set(title=title, xlabel=r'$\theta$', ylabel=r'$\dot\theta$', xlim=(-3, 3), ylim=(-3, 3))
fig.tight_layout()
plt.show()
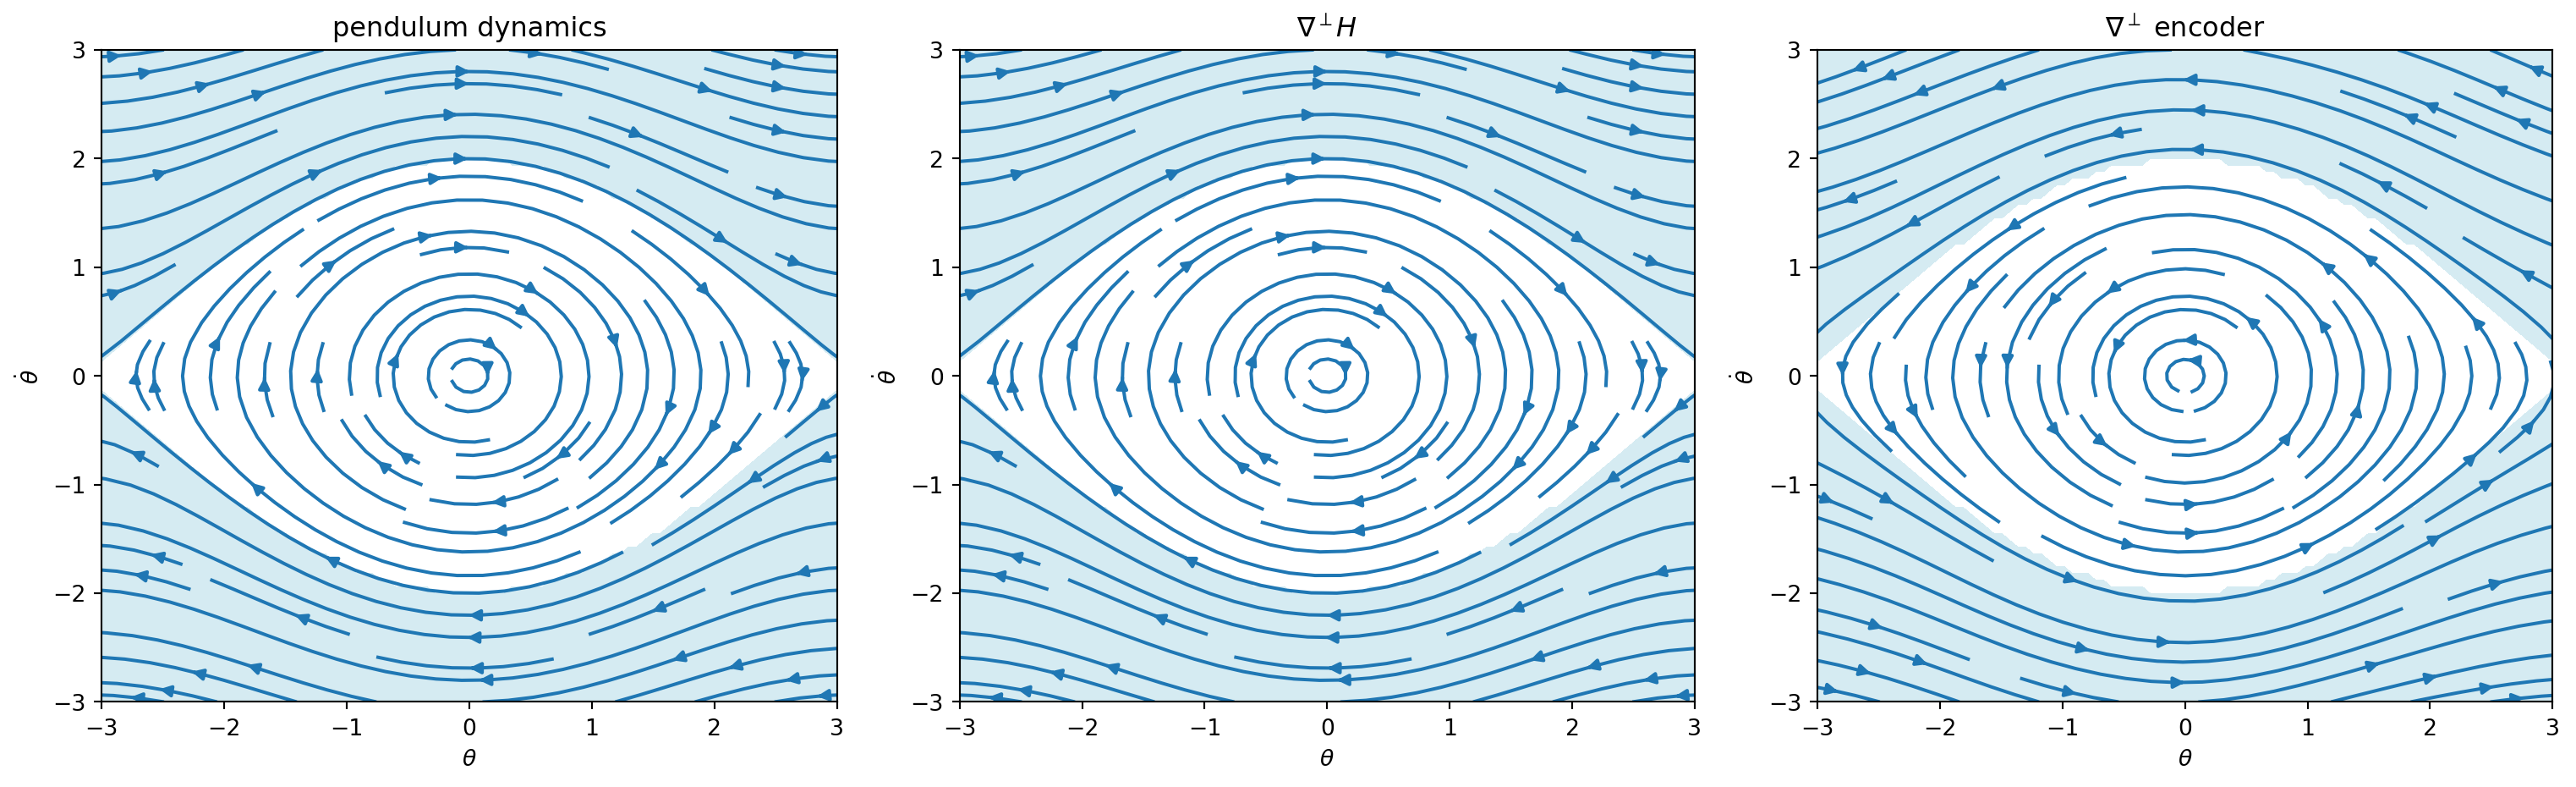
They are following the same lines! Let’s go for the integration.
grad_hamiltonian_fn = F.grad(hamiltonian)
grad_encoder_fn = F.grad(encoder)
def hamiltonian_dyn(t, state):
return perp(grad_hamiltonian_fn(state))
def encoder_dyn(t, state):
return perp(grad_encoder_fn(state))
x0 = torch.tensor([1.0, 0.5])
t_traj = torch.linspace(0, 2, 1000)
traj_pend = odeint(pendulum_dyn, x0, t_traj)
traj_hamiltonian = odeint(hamiltonian_dyn, x0, t_traj)
traj_enc = odeint(encoder_dyn, x0, t_traj)
fig, axs = plt.subplots(1, 3, figsize=(16, 5))
for a, traj, title in zip(axs, [traj_pend, traj_hamiltonian, traj_enc], ['pendulum', r'$\nabla^\perp H$', r'$\nabla^\perp$ encoder']):
a.plot(traj[:, 0].detach(), traj[:, 1].detach())
a.plot(x0[0], x0[1], 'ro', ms=8)
a.set(title=title, xlabel=r'$\theta$', ylabel=r'$\dot\theta$', xlim=(-3, 3), ylim=(-3, 3))
fig.tight_layout()
plt.show()
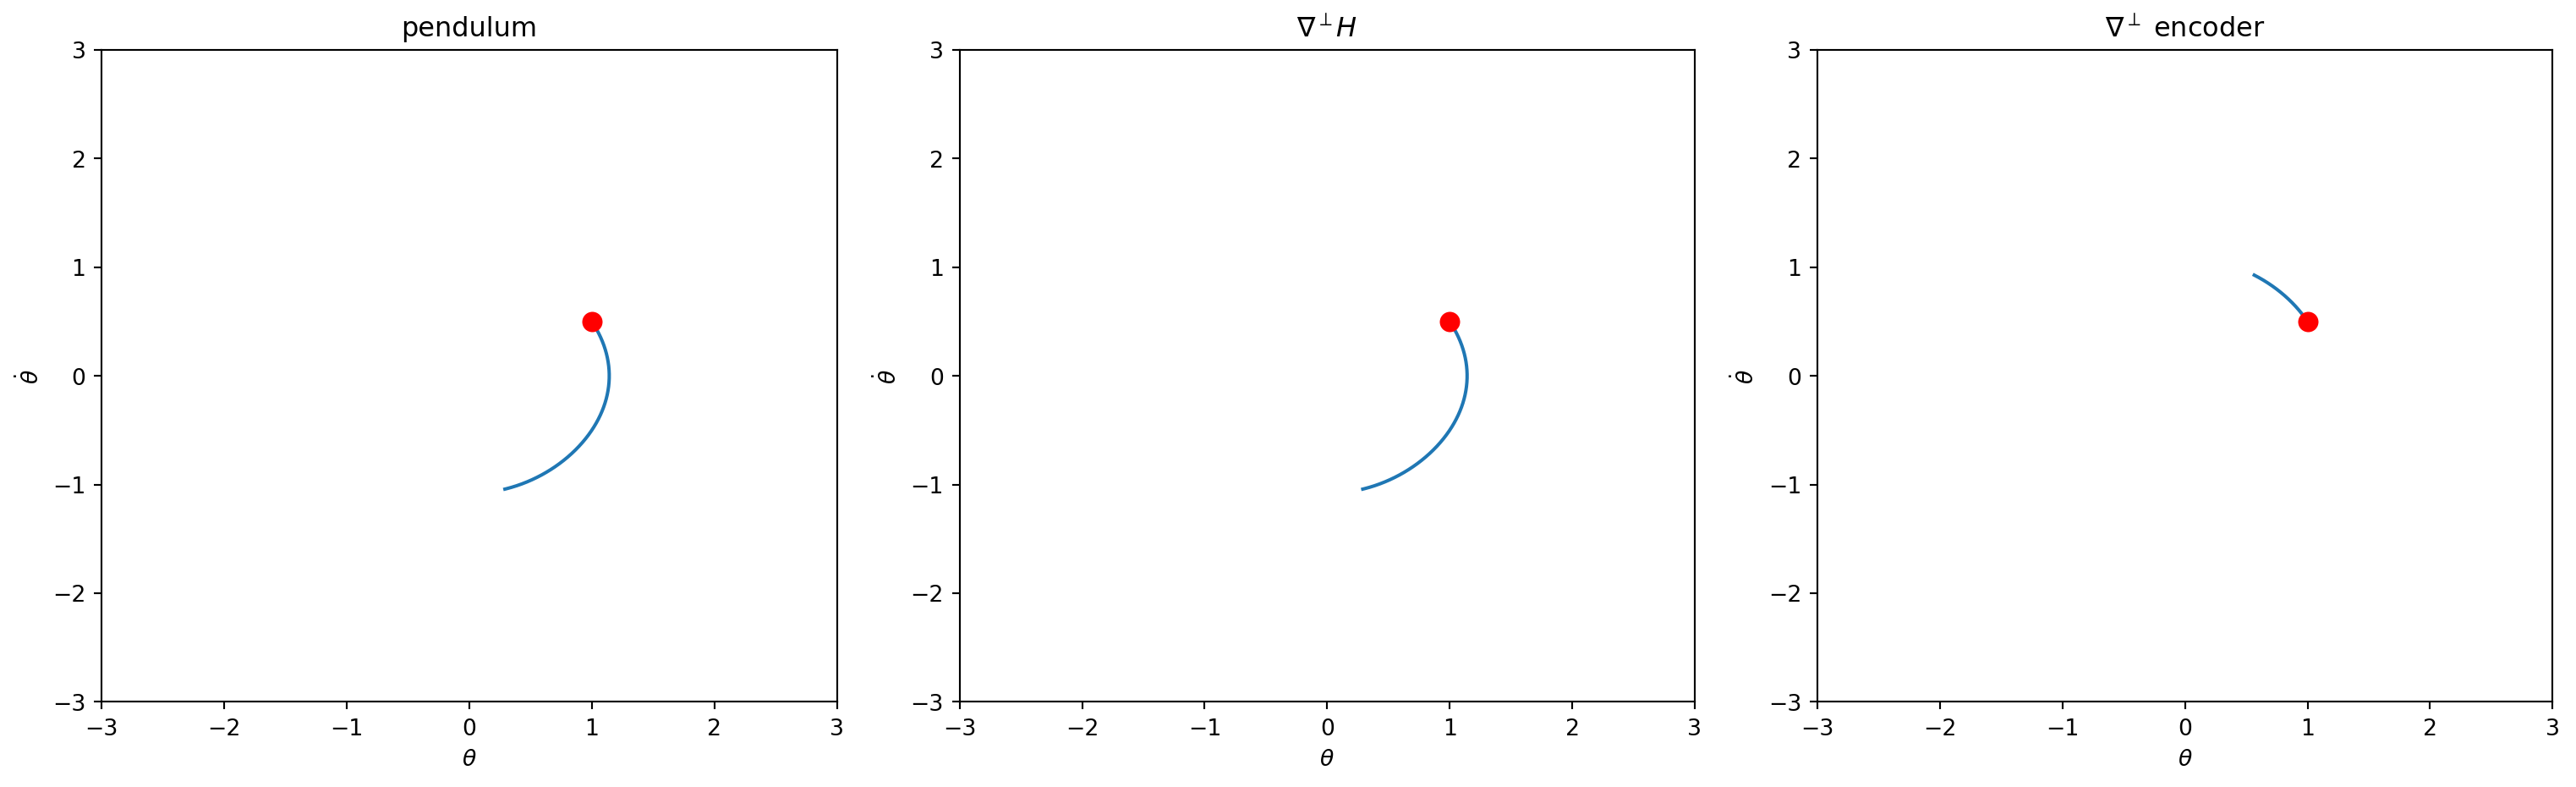
We can see they are on the same orbit, great — but they don’t have the same speed! So far we took \(\kalpha(x) = 1\), an arbitrary scaling of the velocity. To get a proper integration we have to calibrate it.
As mentioned above, we can get the direction of the dynamic from the gradient of the invariant, but we still have to learn its velocity — that’s what we do in this section.
In a data-driven framework this step makes a lot of sense: so far we have only exploited the state information \((\theta_i, \dot\theta_i)\), not the associated time \(t_i\). We need to include it in the training to learn the velocity.
Our dynamic then takes this form, where \(\kc : \mathbb R^p \to \mathbb R\) is the function we want to learn: \[ f_{\theta}(x) = \kc(x) \nabla^{\perp} \kE(x) \]
\[ \theta^* = \underbrace{\arg \min_\theta \int_{x \in \mathbb R^p}||f(x) - f_\theta(x)||dx}_{\text{Offline}} \Longleftrightarrow \theta^* = \underbrace{\arg \min_\theta \sum_{(t_i, x_i) \in \mathcal D}||\Phi(t_i, f, x_i) - \Phi(t_i, f_\theta, x_i)||}_{\text{Online}} \]
You can only use the offline objective if you have access to the true dynamic; the online one only requires observations and their associated times.
Now that we have our learning framework, we can make hypotheses on the form of \(\kc\), which impacts the way we learn it:
\[ \kc(x) \to \kc(\kE(x)) \to \kc \]
From left to right, \(\kc(x)\) depends on the full state, then we hypothesize one \(\kc\) per “level of invariant”, then a single common \(\kc\) for the full dynamic.
In the case of the pendulum we know there exists a Hamiltonian such that: \[ \frac{dx}{dt} = \nabla^{\perp}\kH(x) \] As \(\kH(x)\) and \(\kE(x)\) share the same level sets (they are both constant on the trajectories) we can show that \(\kH(x) = g(\kE(x))\) where \(g\) is a smooth function, then \(\nabla \kH(x)= g'(\kE(x)) \nabla \kE(x)\). Thus \(\kc\) only needs to depend on \(\kE(x)\).
We can implement \(\kc\) as a small network taking the invariant value and returning a velocity:
class Speed(nn.Module):
"""I -> scalar calibration factor c(I), s.t. perp(grad I) * c(I) matches true speed."""
def __init__(self, hidden=32):
super().__init__()
self.net = nn.Sequential(
nn.Linear(1, hidden), nn.Tanh(),
nn.Linear(hidden, hidden), nn.Tanh(),
nn.Linear(hidden, 1),
)
def forward(self, I):
return self.net(I.unsqueeze(-1)).squeeze(-1)
for p in encoder.parameters():
p.requires_grad_(False)
encoder.eval()
speed = Speed()
def calibrated_dyn(x0):
"""Returns dx/dt = c * perp(grad E(x)), with c = c_theta(E(x0)) fixed for the whole rollout —
E(x0) is conserved along the trajectory, so c is constant by construction, not re-derived at each x."""
c = speed(encoder(x0)) # x0 is batched: (n, 2)
def dyn(_, x):
grad_I = F.vmap(grad_encoder_fn)(x)
return perp(grad_I) * c.unsqueeze(-1)
return dynNow we can train Speed very simply:
During this process \(\kE\) is frozen: we only train the velocity network, not the invariant.
dt = (training_set[0, 1, 0] - training_set[0, 0, 0]).item()
x0_pairs = training_set[:, :-1, 1:].reshape(-1, 2) # (n_levels * (n_t - 1), 2)
x1_pairs = training_set[:, 1:, 1:].reshape(-1, 2)
def rollout(x0, dt):
sol = odeint(calibrated_dyn(x0), x0, torch.tensor([0.0, dt]))
return sol[-1]
speed_optimizer = torch.optim.LBFGS(speed.parameters(), lr=1.0, max_iter=20, line_search_fn="strong_wolfe")
n_epochs = 50 # each step() already runs up to max_iter internal iterations
def speed_closure():
speed_optimizer.zero_grad()
x1_hat = rollout(x0_pairs, dt)
loss = (x1_hat - x1_pairs).pow(2).mean()
loss.backward()
return loss
for epoch in range(n_epochs):
loss = speed_optimizer.step(speed_closure)
if epoch % 10 == 0:
print(f"epoch {epoch:4d} loss {loss.item(): .4e}")epoch 0 loss 2.2420e-02
epoch 10 loss 1.6407e-06
epoch 20 loss 1.6407e-06
epoch 30 loss 1.6407e-06
epoch 40 loss 1.6407e-06
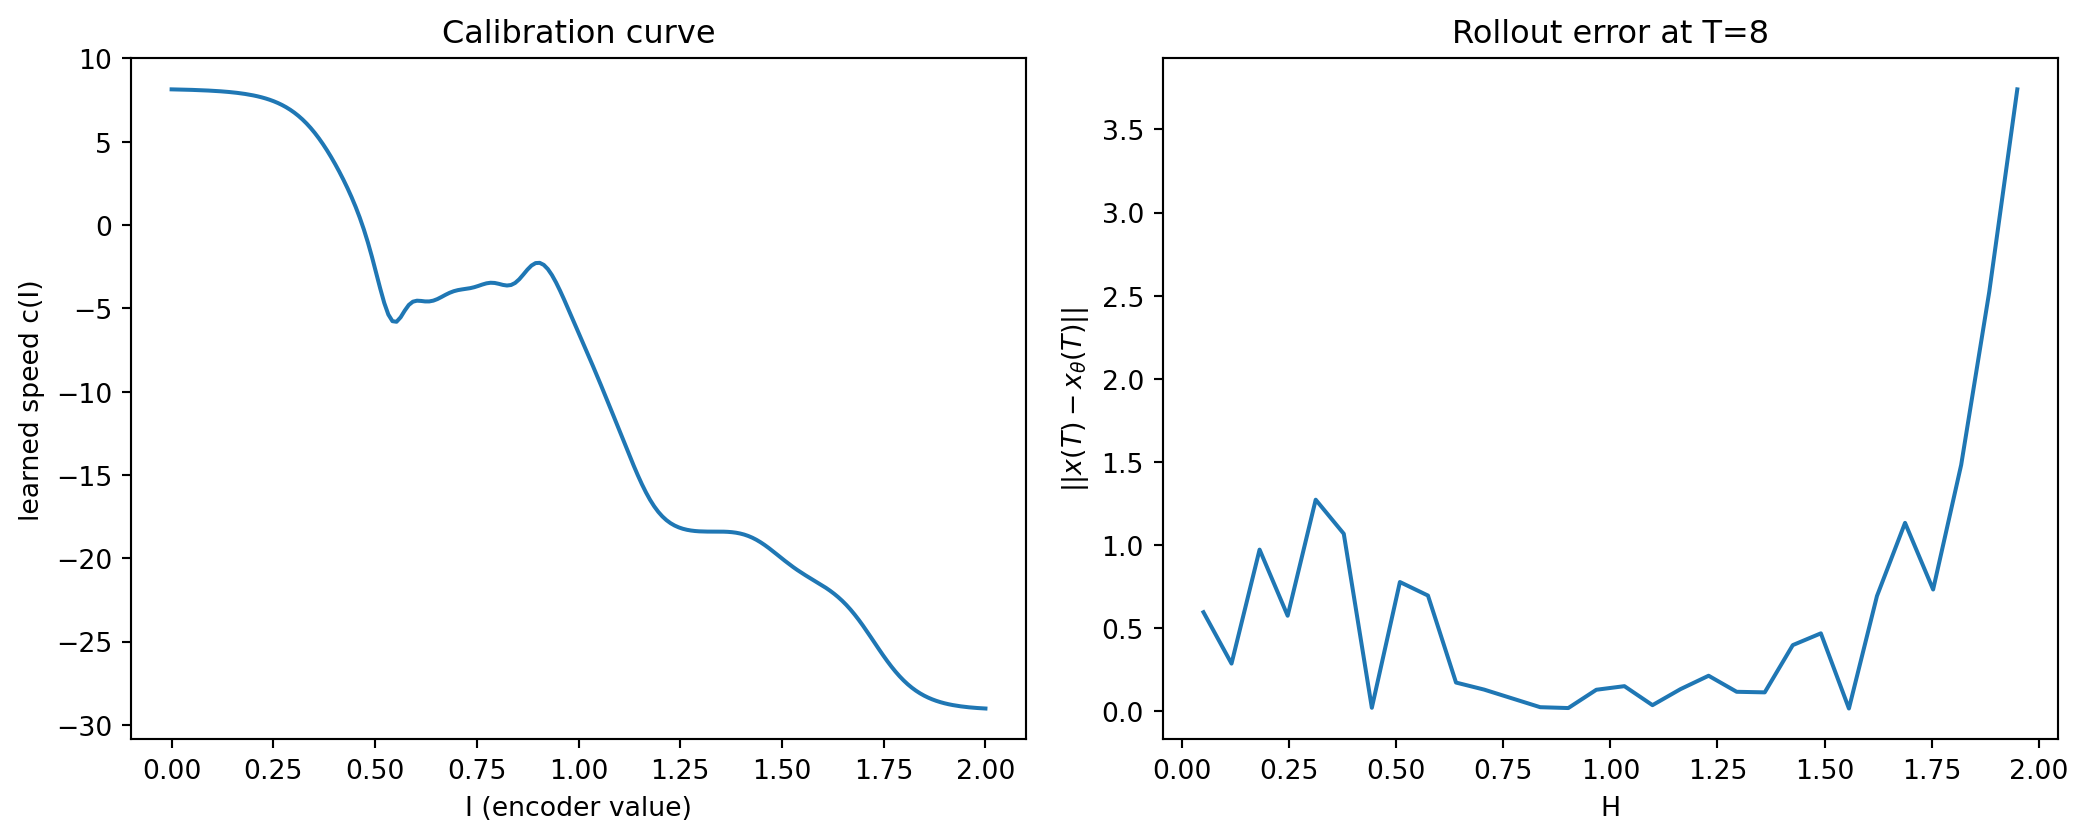
Now that training is done, we can visualize our “calibration curve”: the velocity we associate to each invariant level. We can also check how well it generalizes by rolling out both dynamics to a fixed \(T\) (long enough to cover a full period at any energy level) and measuring \(||x(T) - x_\theta(T)||\) across the energy range.
I_grid = torch.linspace(0.0, 2.0, 200)
c_grid = speed(I_grid).detach()
H_levels = torch.linspace(0.05, 1.95, 30)
starts_err = torch.stack([init_cond(H_levels), torch.zeros_like(H_levels)], dim=-1)
T = 8.0
true_T = odeint(pendulum_dyn, starts_err, torch.tensor([0.0, T]))[-1]
calib_T = odeint(calibrated_dyn(starts_err), starts_err, torch.tensor([0.0, T]))[-1]
err = (true_T - calib_T).norm(dim=-1).detach()
fig, axs = plt.subplots(1, 2, figsize=(11, 4.5))
axs[0].plot(I_grid, c_grid)
axs[0].set(xlabel='I (encoder value)', ylabel='learned speed c(I)', title='Calibration curve')
axs[1].plot(H_levels, err)
axs[1].set(xlabel='H', ylabel=r'$||x(T) - x_\theta(T)||$', title=f'Rollout error at T={T:.0f}')
fig.tight_layout()
plt.show()
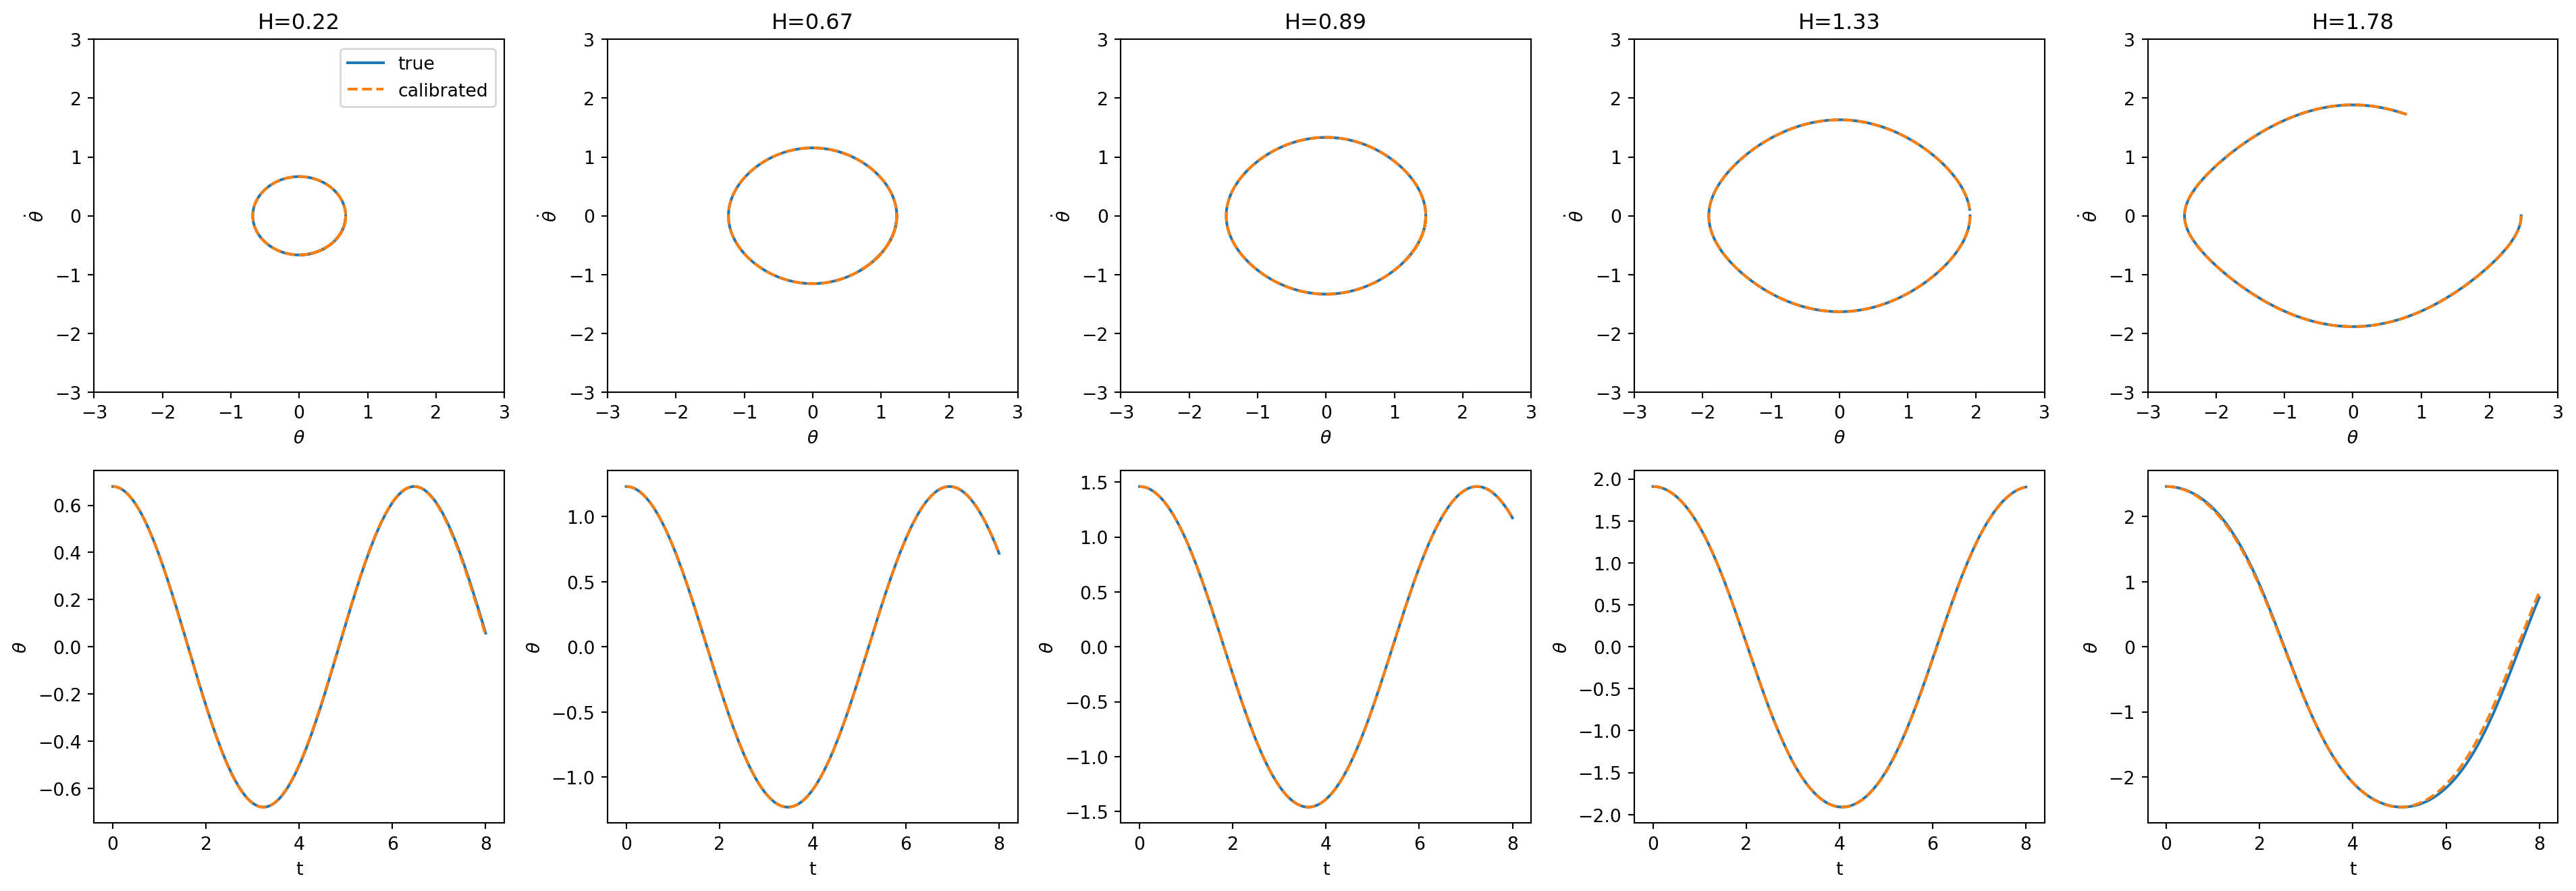
And try integrating with our newly learned dynamic:
n_samples = 5
levels = torch.linspace(1, 8, n_samples).round().long() # skip H=0 (fixed point) and H=2 (separatrix)
starts = training_set[levels, 0, 1:]
t_eval = torch.linspace(0, 8, 300)
true_traj = odeint(pendulum_dyn, starts, t_eval)
calib_traj = odeint(calibrated_dyn(starts), starts, t_eval)
fig, axs = plt.subplots(2, n_samples, figsize=(4 * n_samples, 7))
for i in range(n_samples):
H_i = hamiltonian(starts[i]).item()
ax = axs[0, i]
ax.plot(true_traj[:, i, 0].detach(), true_traj[:, i, 1].detach(), label='true')
ax.plot(calib_traj[:, i, 0].detach(), calib_traj[:, i, 1].detach(), '--', label='calibrated')
ax.set(title=f'H={H_i:.2f}', xlabel=r'$\theta$', ylabel=r'$\dot\theta$', xlim=(-3, 3), ylim=(-3, 3))
if i == 0:
ax.legend()
ax = axs[1, i]
ax.plot(t_eval, true_traj[:, i, 0].detach(), label='true')
ax.plot(t_eval, calib_traj[:, i, 0].detach(), '--', label='calibrated')
ax.set(xlabel='t', ylabel=r'$\theta$')
fig.tight_layout()
plt.show()
---
title: "Representation learning for action-angle coordinates"
author: "Etienne Meunier"
date: today
format:
html:
number-sections: true
code-fold: show
code-tools: true
include-in-header:
text: |
<script>
window.MathJax = {
tex: {
macros: {
kH: ["\\textcolor{#d62728}{H}", 0],
kE: ["\\textcolor{#2ca02c}{\\mathcal E}", 0],
kc: ["\\textcolor{#1f77b4}{c_\\theta}", 0],
kalpha: ["\\textcolor{#8c564b}{\\alpha}", 0]
}
}
};
</script>
---
In this post we show that we can learn the invariant of a dynamic from trajectories alone; those invariants are then useful to infer and learn the dynamic itself. We start with a pendulum and simulate a few trajectories.
```{python}
#| label: imports
#| code-fold: true
#| code-summary: "Show imports"
import torch
import torch.nn as nn
import torch.func as F
import einops
import numpy as np
import matplotlib.pyplot as plt
from torchdiffeq import odeint
```
## Simulating data
We start by simulating a few pendulum trajectories at different energy levels.
$$
\ddot\theta = -\sin\theta
\qquad\Longrightarrow\qquad
\begin{cases}
\dot\theta = \omega \\
\dot\omega = -\sin\theta
\end{cases}
$$
$$
\kH(\theta, \dot\theta) = \tfrac{1}{2}\dot\theta^2 + 1 - \cos\theta
$$
```{python}
#| label: data
def pendulum_dyn(t, state):
return torch.stack([state[..., 1], -torch.sin(state[..., 0])], dim=-1)
def hamiltonian(state):
return 0.5 * state[..., 1] ** 2 + 1 - torch.cos(state[..., 0])
def init_cond(H):
"""theta at rest (thetadot=0) for a given energy H."""
return torch.arccos(1 - H)
t = torch.linspace(0, 20, 100)
init_theta = init_cond(torch.linspace(0, 2, 10))
init_x = torch.stack([init_theta, torch.zeros_like(init_theta)], dim=-1)
training_set = odeint(pendulum_dyn, init_x, t)
t_exp = t[:, None, None].expand(*training_set.shape[:-1], 1)
training_set = torch.cat([t_exp, training_set], dim=-1)
training_set = einops.rearrange(training_set, 't h c -> h t c') # (level, time, [t, theta, thetadot])
```
```{python}
#| label: fig-trajectories
#| fig-cap: "Ten pendulum trajectories released from rest at different energies."
#| code-fold: true
#| code-summary: "Show plotting code"
colors = plt.get_cmap('viridis')(np.linspace(0.1, 0.9, training_set.shape[0]))
fig, ax = plt.subplots(figsize=(5, 5))
for i in range(training_set.shape[0]):
ax.plot(training_set[i, :, 1], training_set[i, :, 2], color=colors[i])
ax.set(xlabel=r'$\theta$', ylabel=r'$\dot\theta$', title='training trajectories', xlim=(-3, 3), ylim=(-3, 3))
plt.show()
```
We know that the energy $\kH$ is conserved along each trajectory — an invariant — and takes a different value for each trajectory, since they start at different points. That's exactly the structure we are going to exploit here.
## Learning an invariant
Our goal is to learn a representation $\kE(\text{state})$ that is the same along a trajectory but different between trajectories — that's simply what we train the model for:
Let $x_{i,t} \sim \mathcal D$ denote the state at time $t$ on trajectory $i$:
$$
\mathcal L = \log\Big(\underbrace{\mathbb E_i\big[\mathrm{Var}_t(\kE(x_{i,t}))\big]}_{\text{consistency}}\Big) - \log\Big(\underbrace{\mathrm{Var}_i\big[\mathbb E_t(\kE(x_{i,t}))\big]}_{\text{diversity}}\Big)
$$
```{python}
#| label: loss
def loss_f(preds):
diversity = preds.mean(dim=1).var() # variance over trajectories
consistency = preds.var(dim=1).mean() # variance over time
loss = torch.log(consistency) - torch.log(diversity)
return loss
```
There is no restriction on the network we want to train, except that it is a smooth $\mathbb R^p \to \mathbb R$ function.
```{python}
#| label: encoder
class Encoder(nn.Module):
"""(theta, thetadot) -> I, a simple 2 -> 1 MLP."""
def __init__(self, hidden=64, n_layers=3):
super().__init__()
layers = [nn.Linear(2, hidden), nn.Tanh()]
for _ in range(n_layers - 1):
layers += [nn.Linear(hidden, hidden), nn.Tanh()]
layers += [nn.Linear(hidden, 1)]
self.net = nn.Sequential(*layers)
def forward(self, x):
return self.net(x).squeeze(-1)
encoder = Encoder()
```
We just train by taking batches of trajectories and minimizing the representation loss.
```{python}
#| label: train-encoder
optimizer = torch.optim.LBFGS(encoder.parameters(), lr=1.0, max_iter=20, line_search_fn="strong_wolfe")
n_epochs = 100 # each step() already runs up to max_iter internal iterations
def closure():
optimizer.zero_grad()
I = encoder(training_set[..., 1:]) # (n_levels, n_times)
loss = loss_f(I)
loss.backward()
return loss
for epoch in range(n_epochs):
loss = optimizer.step(closure)
if epoch % 20 == 0:
print(f"epoch {epoch:4d} loss {loss.item(): .4e}")
```
And now we can visualize the output of the network on our phase space, next to the Hamiltonian.
```{python}
#| label: fig-encoder-output
#| fig-cap: "The Hamiltonian (left) vs. the trained encoder (right), over the phase space."
#| code-fold: true
#| code-summary: "Show plotting code"
g_theta = torch.linspace(-torch.pi, torch.pi, 100)
g_thetadot = torch.linspace(-3, 3, 100)
grid = torch.stack(torch.meshgrid([g_theta, g_thetadot], indexing='xy'), dim=-1)
g_H = hamiltonian(grid)
g_H[g_H > 2] = torch.nan
g_E = encoder(grid).detach()
g_E[hamiltonian(grid) > 2] = torch.nan
fig, axs = plt.subplots(1, 2, figsize=(11, 4.5))
for a, field, title in zip(axs, [g_H, g_E], ['Hamiltonian $H(x)$', 'encoder(x)']):
cf = a.contourf(g_theta, g_thetadot, field)
fig.colorbar(cf, ax=a)
a.set(title=title, xlabel=r'$\theta$', ylabel=r'$\dot\theta$', xlim=(-3, 3), ylim=(-3, 3))
fig.tight_layout()
plt.show()
```
They are quite different — although they share a characteristic: both are smooth functions, monotonically decreasing outward from the fixed point, and since they are both constant on real trajectories they share something even better: contour lines.
```{python}
#| label: fig-contours
#| fig-cap: "Level sets of the Hamiltonian (left) vs. the trained encoder (right) — same shape, arbitrary scale."
#| code-fold: true
#| code-summary: "Show plotting code"
fig, axs = plt.subplots(1, 2, figsize=(11, 4.5))
for a, field, title in zip(axs, [g_H, g_E], ['Hamiltonian $H(x)$', 'encoder(x)']):
a.contour(g_theta, g_thetadot, field, colors='k', linewidths=0.8)
a.set(title=title, xlabel=r'$\theta$', ylabel=r'$\dot\theta$', xlim=(-3, 3), ylim=(-3, 3))
fig.tight_layout()
plt.show()
```
## Dynamics from the contour lines
From the contour lines we can retrieve the direction of the dynamics at each point: $\kH(x(t))$ is constant $\forall t$, so
$$
\frac{d\kH(x)}{dt} = 0 \;\to\; \nabla \kH(x) \cdot \frac{dx}{dt} = 0 \;\to\; \frac{dx}{dt} = \kalpha(x) \nabla^{\perp} \kH(x)
$$
so the dynamics must be a scaling $\kalpha(x)$ of the perp gradient along the contour line, where
$$
\nabla^{\perp} \kH(x) = \begin{bmatrix}0 & 1 \\ -1 & 0\end{bmatrix} \nabla \kH(x)
$$
We can already draw a stream plot of the dynamic, taking $\kalpha(x) = 1$ for now.
```{python}
#| label: fig-perp-gradients
#| fig-cap: "Pendulum dynamics (left) vs. $\\nabla^\\perp \\kH$ (middle) vs. $\\nabla^\\perp\\text{encoder}$ (right). Librium region shaded."
#| code-fold: true
#| code-summary: "Show plotting code"
def perp(g):
return torch.stack([g[..., 1], -g[..., 0]], dim=-1)
grid_req = grid.clone().requires_grad_(True)
grad_E = torch.autograd.grad(hamiltonian(grid_req).sum(), grid_req)[0]
grid_req = grid.clone().requires_grad_(True)
grad_enc = torch.autograd.grad(encoder(grid_req).sum(), grid_req)[0]
mask = (hamiltonian(grid) > 2).float()
pend_vel = torch.stack([grid[..., 1], -torch.sin(grid[..., 0])], dim=-1)
fig, axs = plt.subplots(1, 3, figsize=(16, 5))
titles = ['pendulum dynamics', r'$\nabla^\perp H$', r'$\nabla^\perp$ encoder']
fields = [pend_vel, perp(grad_E), perp(grad_enc)]
for a, title, field in zip(axs, titles, fields):
a.streamplot(g_theta.numpy(), g_thetadot.numpy(), field[..., 0].detach().numpy(), field[..., 1].detach().numpy())
a.contourf(g_theta.numpy(), g_thetadot.numpy(), mask.numpy(), levels=[0.5, 1.5], colors=['lightblue'], alpha=0.5)
a.set(title=title, xlabel=r'$\theta$', ylabel=r'$\dot\theta$', xlim=(-3, 3), ylim=(-3, 3))
fig.tight_layout()
plt.show()
```
They are following the same lines! Let's go for the integration.
```{python}
#| label: fig-integrate-perp
#| fig-cap: "Integrating $\\dot x = \\nabla^\\perp \\kH(x)$ and $\\dot x = \\nabla^\\perp \\text{encoder}(x)$ from the same $x_0$: right shape, wrong speed."
#| code-fold: true
#| code-summary: "Show plotting code"
grad_hamiltonian_fn = F.grad(hamiltonian)
grad_encoder_fn = F.grad(encoder)
def hamiltonian_dyn(t, state):
return perp(grad_hamiltonian_fn(state))
def encoder_dyn(t, state):
return perp(grad_encoder_fn(state))
x0 = torch.tensor([1.0, 0.5])
t_traj = torch.linspace(0, 2, 1000)
traj_pend = odeint(pendulum_dyn, x0, t_traj)
traj_hamiltonian = odeint(hamiltonian_dyn, x0, t_traj)
traj_enc = odeint(encoder_dyn, x0, t_traj)
fig, axs = plt.subplots(1, 3, figsize=(16, 5))
for a, traj, title in zip(axs, [traj_pend, traj_hamiltonian, traj_enc], ['pendulum', r'$\nabla^\perp H$', r'$\nabla^\perp$ encoder']):
a.plot(traj[:, 0].detach(), traj[:, 1].detach())
a.plot(x0[0], x0[1], 'ro', ms=8)
a.set(title=title, xlabel=r'$\theta$', ylabel=r'$\dot\theta$', xlim=(-3, 3), ylim=(-3, 3))
fig.tight_layout()
plt.show()
```
We can see they are on the same orbit, great — but they don't have the same speed! So far we took $\kalpha(x) = 1$, an arbitrary scaling of the velocity. To get a proper integration we have to calibrate it.
## Calibrating
As mentioned above, we can get the direction of the dynamic from the gradient of the invariant, but we still have to learn its velocity — that's what we do in this section.
In a data-driven framework this step makes a lot of sense: so far we have only exploited the state information $(\theta_i, \dot\theta_i)$, not the associated time $t_i$. We need to include it in the training to learn the velocity.
Our dynamic then takes this form, where $\kc : \mathbb R^p \to \mathbb R$ is the function we want to learn:
$$
f_{\theta}(x) = \kc(x) \nabla^{\perp} \kE(x)
$$
$$
\theta^* = \underbrace{\arg \min_\theta \int_{x \in \mathbb R^p}||f(x) - f_\theta(x)||dx}_{\text{Offline}} \Longleftrightarrow \theta^* = \underbrace{\arg \min_\theta \sum_{(t_i, x_i) \in \mathcal D}||\Phi(t_i, f, x_i) - \Phi(t_i, f_\theta, x_i)||}_{\text{Online}}
$$
::: {.callout-tip}
You can only use the offline objective if you have access to the true dynamic; the online one only requires observations and their associated times.
:::
### Hypothesis on the form of $\kc$
Now that we have our learning framework, we can make hypotheses on the form of $\kc$, which impacts the way we learn it:
$$
\kc(x) \to \kc(\kE(x)) \to \kc
$$
From left to right, $\kc(x)$ depends on the full state, then we hypothesize one $\kc$ per "level of invariant", then a single common $\kc$ for the full dynamic.
::: {.callout-note title="What makes sense in the pendulum case?"}
In the case of the pendulum we know there exists a Hamiltonian such that:
$$
\frac{dx}{dt} = \nabla^{\perp}\kH(x)
$$
As $\kH(x)$ and $\kE(x)$ share the same level sets (they are both constant on the trajectories) we can show that $\kH(x) = g(\kE(x))$ where $g$ is a smooth function, then $\nabla \kH(x)= g'(\kE(x)) \nabla \kE(x)$. Thus $\kc$ only needs to depend on $\kE(x)$.
:::
We can implement $\kc$ as a small network taking the invariant value and returning a velocity:
```{python}
#| label: speed-net
class Speed(nn.Module):
"""I -> scalar calibration factor c(I), s.t. perp(grad I) * c(I) matches true speed."""
def __init__(self, hidden=32):
super().__init__()
self.net = nn.Sequential(
nn.Linear(1, hidden), nn.Tanh(),
nn.Linear(hidden, hidden), nn.Tanh(),
nn.Linear(hidden, 1),
)
def forward(self, I):
return self.net(I.unsqueeze(-1)).squeeze(-1)
for p in encoder.parameters():
p.requires_grad_(False)
encoder.eval()
speed = Speed()
def calibrated_dyn(x0):
"""Returns dx/dt = c * perp(grad E(x)), with c = c_theta(E(x0)) fixed for the whole rollout —
E(x0) is conserved along the trajectory, so c is constant by construction, not re-derived at each x."""
c = speed(encoder(x0)) # x0 is batched: (n, 2)
def dyn(_, x):
grad_I = F.vmap(grad_encoder_fn)(x)
return perp(grad_I) * c.unsqueeze(-1)
return dyn
```
### Learning $\kc(\kE)$?
Now we can train `Speed` very simply:
::: {.callout-tip title="Training recipe"}
1. Take a pair of points from the same trajectory ($x_{t_1}$, $x_{t_2}$)
2. Compute $c = \kc(\kE(x_{t_1}))$ from our model
3. Integrate from $x_{t_1}$ for $(t_2 - t_1)$ time with dynamic $f_\theta(x) = c\, \nabla^{\perp} \kE(x)$
4. Backpropagate the loss through the integration
:::
During this process $\kE$ is frozen: we only train the velocity network, not the invariant.
```{python}
#| label: fit-speed
dt = (training_set[0, 1, 0] - training_set[0, 0, 0]).item()
x0_pairs = training_set[:, :-1, 1:].reshape(-1, 2) # (n_levels * (n_t - 1), 2)
x1_pairs = training_set[:, 1:, 1:].reshape(-1, 2)
def rollout(x0, dt):
sol = odeint(calibrated_dyn(x0), x0, torch.tensor([0.0, dt]))
return sol[-1]
speed_optimizer = torch.optim.LBFGS(speed.parameters(), lr=1.0, max_iter=20, line_search_fn="strong_wolfe")
n_epochs = 50 # each step() already runs up to max_iter internal iterations
def speed_closure():
speed_optimizer.zero_grad()
x1_hat = rollout(x0_pairs, dt)
loss = (x1_hat - x1_pairs).pow(2).mean()
loss.backward()
return loss
for epoch in range(n_epochs):
loss = speed_optimizer.step(speed_closure)
if epoch % 10 == 0:
print(f"epoch {epoch:4d} loss {loss.item(): .4e}")
```
Now that training is done, we can visualize our "calibration curve": the velocity we associate to each invariant level. We can also check how well it generalizes by rolling out both dynamics to a fixed $T$ (long enough to cover a full period at any energy level) and measuring $||x(T) - x_\theta(T)||$ across the energy range.
```{python}
#| label: fig-calibration-curve
#| fig-cap: "Calibration curve $c(I)$ (left) and rollout error $||x(T) - x_\\theta(T)||$ at $T=8$ across energy levels (right)."
#| code-fold: true
#| code-summary: "Show plotting code"
I_grid = torch.linspace(0.0, 2.0, 200)
c_grid = speed(I_grid).detach()
H_levels = torch.linspace(0.05, 1.95, 30)
starts_err = torch.stack([init_cond(H_levels), torch.zeros_like(H_levels)], dim=-1)
T = 8.0
true_T = odeint(pendulum_dyn, starts_err, torch.tensor([0.0, T]))[-1]
calib_T = odeint(calibrated_dyn(starts_err), starts_err, torch.tensor([0.0, T]))[-1]
err = (true_T - calib_T).norm(dim=-1).detach()
fig, axs = plt.subplots(1, 2, figsize=(11, 4.5))
axs[0].plot(I_grid, c_grid)
axs[0].set(xlabel='I (encoder value)', ylabel='learned speed c(I)', title='Calibration curve')
axs[1].plot(H_levels, err)
axs[1].set(xlabel='H', ylabel=r'$||x(T) - x_\theta(T)||$', title=f'Rollout error at T={T:.0f}')
fig.tight_layout()
plt.show()
```
And try integrating with our newly learned dynamic:
```{python}
#| label: fig-calibrated-vs-true
#| fig-cap: "True vs. calibrated dynamics at five energy levels — phase portrait (top), $\\theta(t)$ (bottom)."
#| code-fold: true
#| code-summary: "Show plotting code"
n_samples = 5
levels = torch.linspace(1, 8, n_samples).round().long() # skip H=0 (fixed point) and H=2 (separatrix)
starts = training_set[levels, 0, 1:]
t_eval = torch.linspace(0, 8, 300)
true_traj = odeint(pendulum_dyn, starts, t_eval)
calib_traj = odeint(calibrated_dyn(starts), starts, t_eval)
fig, axs = plt.subplots(2, n_samples, figsize=(4 * n_samples, 7))
for i in range(n_samples):
H_i = hamiltonian(starts[i]).item()
ax = axs[0, i]
ax.plot(true_traj[:, i, 0].detach(), true_traj[:, i, 1].detach(), label='true')
ax.plot(calib_traj[:, i, 0].detach(), calib_traj[:, i, 1].detach(), '--', label='calibrated')
ax.set(title=f'H={H_i:.2f}', xlabel=r'$\theta$', ylabel=r'$\dot\theta$', xlim=(-3, 3), ylim=(-3, 3))
if i == 0:
ax.legend()
ax = axs[1, i]
ax.plot(t_eval, true_traj[:, i, 0].detach(), label='true')
ax.plot(t_eval, calib_traj[:, i, 0].detach(), '--', label='calibrated')
ax.set(xlabel='t', ylabel=r'$\theta$')
fig.tight_layout()
plt.show()
```